1. Overview
Graphs of functions are visual representations of mathematical relationships, showing how the output (-value) changes with the input (-value). Understanding graphs allows you to solve equations, identify key features like maximum and minimum points, and model real-world situations. This topic covers plotting graphs from equations, recognizing common graph shapes, and using graphs to solve equations.
Key Definitions
- Function: A mathematical relationship where each input () has a unique output ().
- Gradient: The steepness of a line, calculated as .
- Intercept: The point where a graph crosses an axis (y-intercept is where ; x-intercept/root is where ).
- Root: The -value(s) where the graph crosses the x-axis (i.e., where ).
- Asymptote: A line that a graph approaches but never actually touches or crosses (common in reciprocal and exponential graphs).
- Stationary Point: A point on a curve where the gradient is zero (a maximum or minimum).
Core Content
3.1 Constructing Tables and Drawing Graphs
To draw any graph, you must first create a table of values.
- Choose or use the given range of -values.
- Substitute each into the function to find .
- Plot the coordinates on a Cartesian plane.
- Join the points: use a ruler for linear graphs () and a smooth curve for all others.
3.2 Common Graph Shapes (Core)
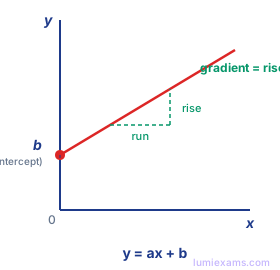
- Linear (): A straight line. is the gradient, is the y-intercept.
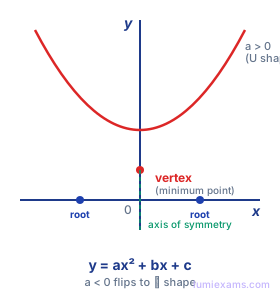
- Quadratic (): A U-shaped curve called a parabola.
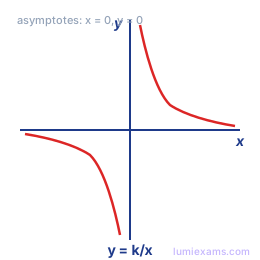
- Reciprocal (): Two separate curves in opposite quadrants. It never touches or .
3.3 Solving Equations Graphically
To solve :
- Draw the graph of .
- Draw the horizontal line .
- The solutions (roots) are the -coordinates where the two lines intersect.
Worked example 1 — Solving a quadratic graphically
Question: Draw the graph of for and use it to solve .
Step 1: Table of values
| -2 | -1 | 0 | 1 | 2 | 3 | 4 | |
|---|---|---|---|---|---|---|---|
| 5 | 0 | -3 | -4 | -3 | 0 | 5 |
Calculation for :
Step 2: Plot and Solve Plot the points and join with a smooth curve. To solve , look at where the graph crosses the x-axis (). Solutions: and .
Worked example 2 — Solving a linear equation graphically
Question: Draw the graph of for . Use your graph to solve .
Step 1: Table of values
| -1 | 0 | 1 | 2 | 3 | |
|---|---|---|---|---|---|
| -3 | -1 | 1 | 3 | 5 |
Calculation for :
Step 2: Plot the graph Plot the points and join them with a straight line using a ruler.
Step 3: Solve Draw the horizontal line on the same graph. Find the x-coordinate of the point where the line intersects the line .
Solution:
Extended Content (Extended Only)
4.1 Advanced Power Functions ()
You must recognize shapes for various values of :
- (Cubic): . An S-shaped curve passing through the origin.
- (Square Root): . Only exists for .
- (Reciprocal): . (See Core).
- (Inverse Square): . Both parts of the curve are above the x-axis.
Worked example 3 — Sketching an inverse square function
Question: Sketch the graph of .
Step 1: Consider the behavior as x approaches 0 As gets closer to 0, becomes very large. The y-axis is a vertical asymptote.
Step 2: Consider the behavior as x approaches infinity As gets very large (positive or negative), approaches 0. The x-axis is a horizontal asymptote.
Step 3: Note the symmetry Since is squared, the function is symmetrical about the y-axis.
Step 4: Sketch the graph Draw a curve in the first quadrant that approaches both axes but never touches them. Draw a symmetrical curve in the second quadrant. Both curves should be above the x-axis.
4.2 Exponential Graphs ()
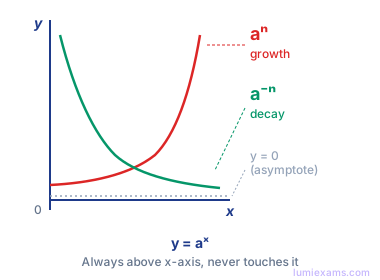
Used for growth () or decay ().
- The graph increases rapidly as increases.
- The line is the horizontal asymptote.
Worked example 4 — Finding the intersection of an exponential and a linear function
Question: Find the intersection of and .
Step 1: Table of values for
| -1 | 0 | 1 | 2 | |
|---|---|---|---|---|
| 0.5 | 1 | 2 | 4 |
Step 2: Table of values for
| -1 | 0 | 1 | 2 | |
|---|---|---|---|---|
| 4 | 3 | 2 | 1 |
Step 3: Plot both functions Draw the curve for and the straight line for . The intersection point is approximately , . Solution: .
4.3 Determining the Nature of Stationary Points
If asked to prove if a point is a maximum or minimum:
- Find the second derivative .
- Substitute the -value of the stationary point.
- If , it is a Minimum.
- If , it is a Maximum.
Worked example 5 — Determining the nature of a stationary point
Question: The function has a stationary point at . Determine whether this point is a maximum or a minimum.
Step 1: Find the first derivative
Step 2: Find the second derivative
Step 3: Substitute the x-value of the stationary point Substitute into the second derivative:
Step 4: Determine the nature of the stationary point Since , the stationary point at is a Maximum.
Key Equations
Linear Gradient: (Not on formula sheet)
Linear Equation: (Not on formula sheet)
Quadratic Form: (Not on formula sheet)
Exponential Growth/Decay: (Not on formula sheet)
Note: These formulas are NOT provided on the IGCSE formula sheet; they must be memorized.
Common Mistakes to Avoid
- ❌ Incorrect Gradient Calculation: Calculating the gradient by simply counting squares on the graph without considering the scale of the axes.
- ✓ Correct Gradient Calculation: Use the coordinates of two points on the line and the formula , paying close attention to the scale on each axis. For example, if each square on the x-axis represents 0.5 units and each square on the y-axis represents 2 units, account for this in your calculation.
- ❌ Joining Non-Linear Points with a Ruler: Drawing a quadratic or cubic graph by connecting the plotted points with straight lines.
- ✓ Drawing Smooth Curves: Join the points with a smooth, continuous curve. The curve should pass through all the points and not have any sharp corners.
- ❌ Ignoring the Negative Sign in Substitution: Incorrectly substituting negative values into a function, especially when squaring. For example, calculating as instead of .
- ✓ Using Brackets for Negative Numbers: Always use brackets when substituting negative numbers into a function, especially when using a calculator. For example, write to ensure the calculator squares the entire negative number.
- ❌ Incorrectly Identifying Roots: Reading the roots of the equation as the y-coordinates of the intersection points instead of the x-coordinates.
- ✓ Correctly Identifying Roots: Remember that the roots are the x-values where the graph of intersects the line .
Exam Tips
- Command Words:
- "Plot": Precisely place points and join them.
- "Sketch": Draw the general shape and label intercepts (no grid needed).
- Calculator Tip: Use the "Table" mode on your scientific calculator to generate -values quickly for a given function. This prevents manual calculation errors.
- Scale: Check the scale of the axes carefully. Sometimes 1 unit is 2cm on the x-axis but 1cm on the y-axis.
- Real-world Context: Expect exponential graphs in questions about bacteria growth, compound interest, or radioactive decay. The y-intercept usually represents the "initial amount."
- Accuracy: When solving graphically, your answer should be within of the exact value. Always draw the construction lines (the dashed lines from the graph to the axes) to show the examiner where your answer came from.